Quantifying the ROI of AI: Why You're Measuring the Wrong Things
Most enterprise AI initiatives are measured with metrics designed for optimization, not transformation. Learning to distinguish between the two—and measure accordingly—is the key to AI investment success.
Loading content...
The Pitch I (Almost) Couldn't Close
In 2022, I stood in front of Tableau's CEO and Chief Product Officer pitching an early-stage product called Pulse. We believed it could become an easier analytics experience for business users. Something that would change how non-technical people interact with their data.
The question came, as it always does: "How do you know this will work?"
I fumbled. I had prepared "old world" metrics. Weekly Active Users. Percentage of feature engagement. Retention curves. The metrics any product leader would bring to a funding conversation. But there was a problem I couldn't talk my way around: none of that data existed. It couldn't exist. We hadn't built anything yet. I was asking for investment to discover whether the opportunity was real, and I was being asked to prove the outcome before running the experiment.
Pulse shipped. It's in market today. But I left that room without the language to explain why the question itself was wrong. Or rather, why it was the wrong question for that moment.
I've since learned that language. And I think it matters for every executive currently struggling to answer their board's questions about AI ROI.
The Wrong Question
Most enterprise AI initiatives are being measured with metrics designed for a different kind of work.
When a board asks "What's the ROI on our AI investment?" they're asking a reasonable question. But the answer depends entirely on what kind of AI work you're doing. And most organizations are doing two kinds simultaneously without distinguishing between them.
The two kinds are optimization and transformation. Optimization improves a system you already understand. The inputs, the outputs, and the definition of success are known, and the work is making the thing cheaper, faster, or more reliable. Transformation is different in kind. You're trying to discover whether something new is even possible, and you can't specify the outcome in advance, because that's the thing you're trying to find out.
The metrics for these are fundamentally different. Optimization can be measured in efficiency gains, cost reduction, productivity improvement, because you're improving a known system. Transformation cannot, because you're mapping an unknown one.
The mistake is judging both with one yardstick. Scott Anthony put the trap plainly:
If a company is using the same metrics before and after its so-called transformation effort, it really hasn't transformed in a material way.
— Scott Anthony, Dual Transformation
Most AI investments today contain both types of work, tangled together. Improving an existing workflow (optimization) and discovering a new capability (transformation) often happen in the same initiative, on the same team, with the same budget. The confusion comes from failing to distinguish which is which and then measuring all of it with the metrics built for optimization.
When you measure transformation work with efficiency metrics, you get one of two outcomes: you kill promising initiatives before they have time to prove themselves, or you warp them into incremental improvements that never discover anything new.
This isn't just a measurement problem. It's a pattern that repeats every time a transformative technology arrives. Introducing: The J-Curve.
The J-Curve You're Standing In
There's an economic pattern here that's been well-documented but remains underappreciated in boardrooms.
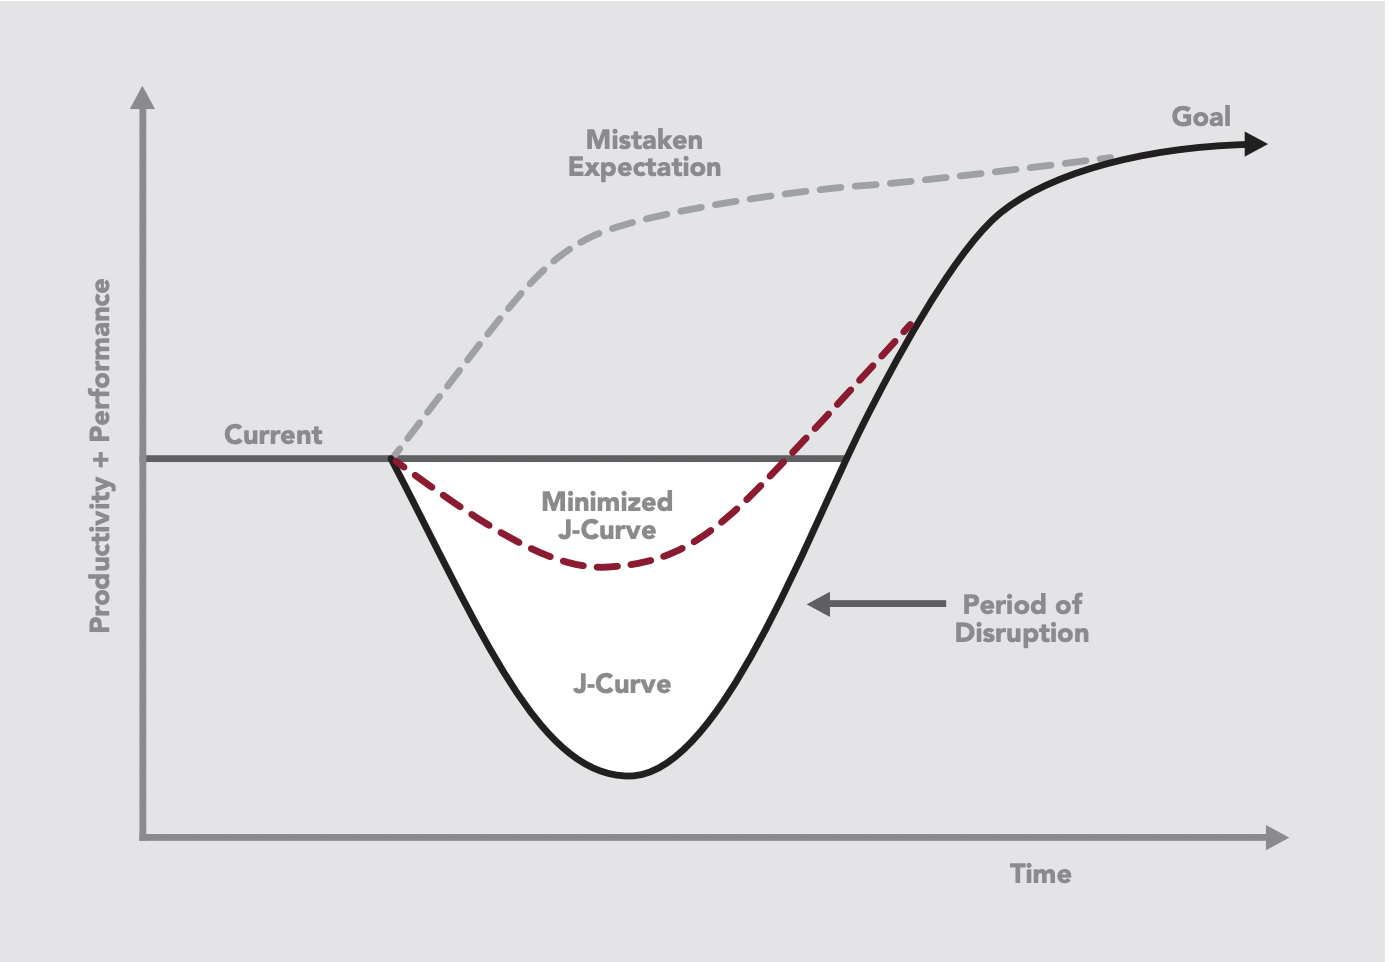
Erik Brynjolfsson and his colleagues at MIT call it the "Productivity J-Curve." Their research shows that general purpose technologies like steam, electricity, computing, and now AI follow a predictable pattern. Early investment produces negative measured productivity. The gains come later, sometimes much later.
The J-Curve effect: performance dips before gains emerge. Source: DeGeest Corporation
Why? Because the real value of a general purpose technology requires what economists call "complementary investments." New business processes. Management capabilities. Workforce skills. Organizational structures. These investments are intangible. They don't show up on balance sheets. But they're where the actual transformation happens.
The electricity analogy is more instructive than most people realize. Commercial electrical power existed in the late 1880s, but factories didn't see significant productivity gains until the 1920s. That's a 30-year lag. And the reason wasn't technological. It was organizational.
A steam-powered factory with centralized line shaft system, circa 1900
In the steam era, factories used a "line shaft" system. One massive steam engine powered everything through a complex network of shafts and belts. This dictated the entire factory layout. Machines clustered around the power source. Buildings went vertical to stay close to the shaft. Resistance to change was structural, literally built into the architecture.
When electric motors arrived, early adopters made a predictable mistake: they simply replaced the steam engine with an electric motor, keeping the same layout. The gains were marginal. Electricity looked like an expensive way to do the same thing.
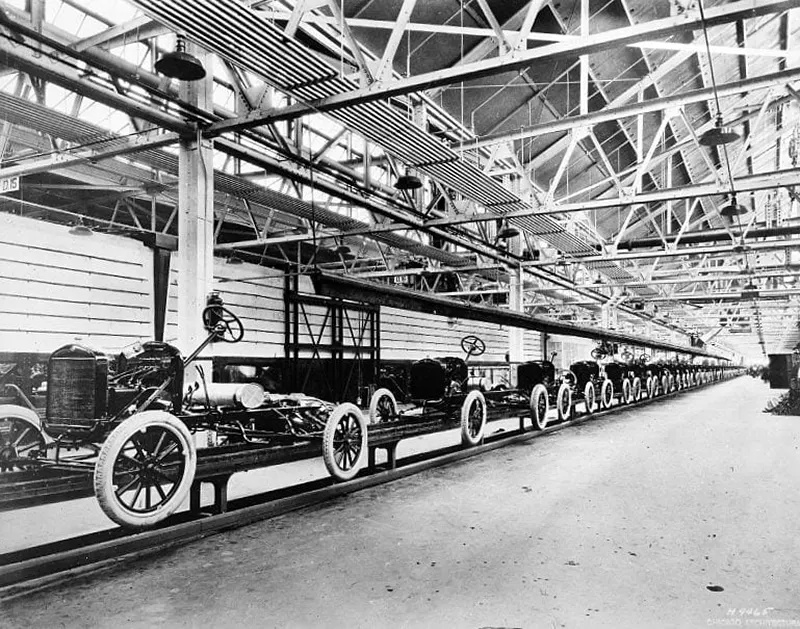
The real transformation came when manufacturers realized electricity enabled "unit drive," where each machine has its own motor. This unlocked entirely new possibilities. Single-story buildings. Flexible layouts. Reconfigurable production lines. Flow-based manufacturing.
Ford's Highland Park plant with electric unit drive, enabling single-story layouts and flow-based manufacturing
The resistance wasn't about doubting electricity's potential. It was about the deep reorganization required to capture that potential.
Here's the insight that matters for AI: asking "what's the cost savings?" is like asking "is the electric motor more efficient than steam?" It's the wrong question. The value isn't in the motor. It's in the reorganization electricity enables.
The resistance to AI transformation isn't skepticism about the technology. It's the difficulty of making the complementary investments in people, processes, and technology that allow it to matter.
Brynjolfsson's research suggests we're in the early phase of the AI J-curve right now. Organizations are making significant investments, and measured productivity gains are modest. This isn't evidence that AI doesn't work. It's evidence that the complementary investments are still being made. The process redesign. The skill development. The organizational learning.
The problem is that boards don't fund J-curves. They fund ROI projections. And the honest answer to "when will this pay off?" is often "we don't know yet, because we're still learning what's possible."
There's a fair objection here, and every CFO will raise it: "we're early in the J-curve" is exactly what someone says to defend an initiative that's quietly failing. If negative productivity is the expected signal, how do you ever tell a trough you should fund through from a dead end you should kill?
This is not the indicator you're looking for. A J-curve and a dead end look identical on a productivity chart. The difference only shows up on a learning chart. In a trough, output stays flat while learning compounds: the problem gets sharper each sprint, the hypotheses get better, and the ratio of validated to invalidated climbs. In a dead end, neither moves. You're spending, and you're no smarter than you were a quarter ago.
That's the falsifiable test, and it's why the metrics that follow matter. The J-curve earns patience only while learning velocity is rising. That means making the complementary investments: redesigning the process, not bolting AI onto the old workflow. Do that, and the leading indicators show it long before the financials do. If they're flat, you don't have a J-curve. You have an electric motor wired into a steam-era factory, and no amount of waiting fixes the layout.
What to Measure Instead
If traditional ROI metrics fail for transformation work, what do you measure?
The answer comes from innovation accounting, a set of practices developed in the startup world for exactly this problem. When revenue, customers, and market share are effectively zero, you need different indicators of progress. The goal isn't to measure output (the work of optimization). It's to measure learning velocity (the work of transformation).
Here's what that looks like in practice:
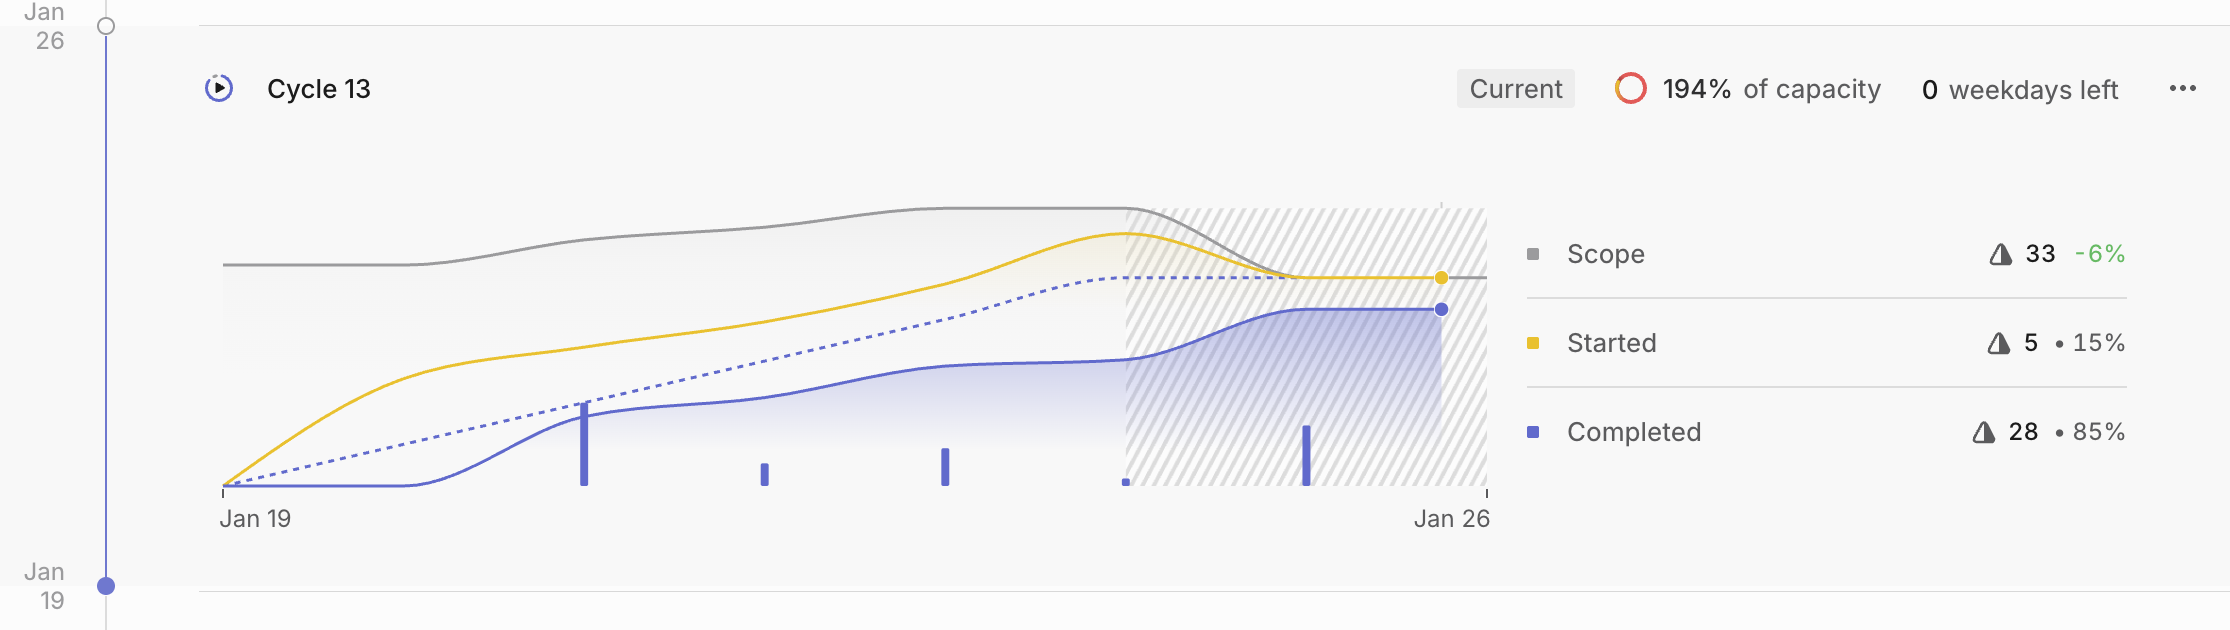
Measuring experiment velocity and cycle time to insight using existing agile tooling
Experiment velocity. How many experiments is your team running per sprint? This isn't about success or failure. It's about the rate at which you're testing assumptions. A team running one experiment per week is learning faster than a team running one per month. We benchmark against at least one meaningful experiment per sprint for teams doing transformation work.
Learning ratio. Of the experiments you run, how many produce validated learning? An experiment is successful when it conclusively validates or invalidates a hypothesis. Not when it produces the outcome you wanted. A team with high experiment velocity but low learning ratio is running bad experiments. They need coaching on experimental design.
Cycle time to insight. How long does it take from "we have a question" to "we have an answer"? This borrows from agile development metrics. In software, we measure cycle time from work started to work completed. In innovation, we measure cycle time from hypothesis formed to hypothesis tested. Shorter cycles mean faster learning.
Cost per learning. What did it cost to learn each thing you learned? Time, resources, attention. This isn't about minimizing cost. It's about understanding efficiency. A team that spends $500K to learn something important may be more efficient than a team that spends $50K to learn nothing.
These metrics feel foreign to finance teams accustomed to revenue forecasts and cost projections. But they answer the question that actually matters for transformation work: Is this team getting smarter about the opportunity?
Making It Concrete: Tiger Teams and Hypothesis Backlogs
We're currently implementing these metrics with clients using their existing agile tooling. Here's how it works in practice.
Small tiger teams of one to three people validate hypotheses across three dimensions: technical feasibility (can we actually build this?), customer desirability (do customers actually want this?), and business viability (does this make business sense?). A hypothesis is validated if it's conclusively proven or disproven. Both are valuable outcomes.
Teams maintain a hypothesis backlog that looks something like this:
Hypothesis
Category
Sprint
Result
We can build a prototype that schedules client meetings with AEs
Feasibility
Jan 6-17
Push
Customers will accept AI-generated proposals instead of templates
Desirability
Jan 13-24
Pivot
Running 1,000 prompts/day costs less than $50/day
Viability
Jan 6-10
Push
Users will trust AI summaries of legal documents
Desirability
Jan 20-Feb 3
Pause
Results translate to decisions. Push means validated, scale it. Pivot means the learning suggests a new direction. Pause means invalidated, stop investing.
The sprint cadence is short. One to two weeks. Break complex hypotheses into smaller, testable chunks. Track velocity: experiments completed per sprint. Retrospect weekly: what did we learn? What slowed us down?
The goal isn't shipping features. It's generating validated learnings as fast as possible. Scale only what shows promise. Accept that most hypotheses will not.
The Switch
None of this means efficiency metrics are wrong. It means they're wrong for transformation. They're the metrics of optimization applied to the work of transformation.
At some point, transformation work must give way to optimization. You discover a real opportunity, validate the business model, and shift into scaling mode. That's when traditional metrics become appropriate. You're no longer discovering. You're executing.
The leader's job is knowing when to make the switch.
This is the part I can't give you a formula for. There's no metric that tells you "stop discovering, start scaling." It's judgment. Pattern recognition. The felt sense that you've found something real.
But I can offer some signs you might be ready:
You've validated the core value proposition with real users, not just enthusiastic early adopters. You've identified a repeatable motion, something that works more than once, with more than one customer. The team has shifted from asking "is this possible?" to asking "how do we scale this?"
And signs you're switching too early:
You're under pressure to show ROI and chasing metrics before you've found the opportunity. Your "successful" pilot worked, but you don't understand why it worked. You're scaling a process that only succeeds with heroic individual effort.
The hardest thing for executives to accept is that the switch from transformation to optimization is not a metrics decision. It's a leadership decision informed by metrics. The data tells you what's happening. It doesn't tell you what to do about it.
What I Know Now
If I could return to that room in 2022, pitching Pulse to the CEO and CPO, I'd say something different.
I'd say: "I can't tell you this will work. No one can, at this stage. That's not a failure of analysis. That's the nature of transformation work. What I can tell you is how we'll learn fast. How many experiments we'll run. How quickly we'll validate or kill our hypotheses. And what it will cost us to find out if this opportunity is real."
I'd say: "The question isn't 'what's the ROI?' The question is 'what's our learning velocity?' Are we getting smarter about this opportunity faster than the market is moving? That's what I can measure. That's what I can commit to."
I'd say: "And when we find it, when we validate something real, then we'll talk about efficiency metrics. Then we'll build the dashboards and forecasts you're asking for. But not yet. Because measuring the wrong thing doesn't just fail to help. It actively distorts the work."